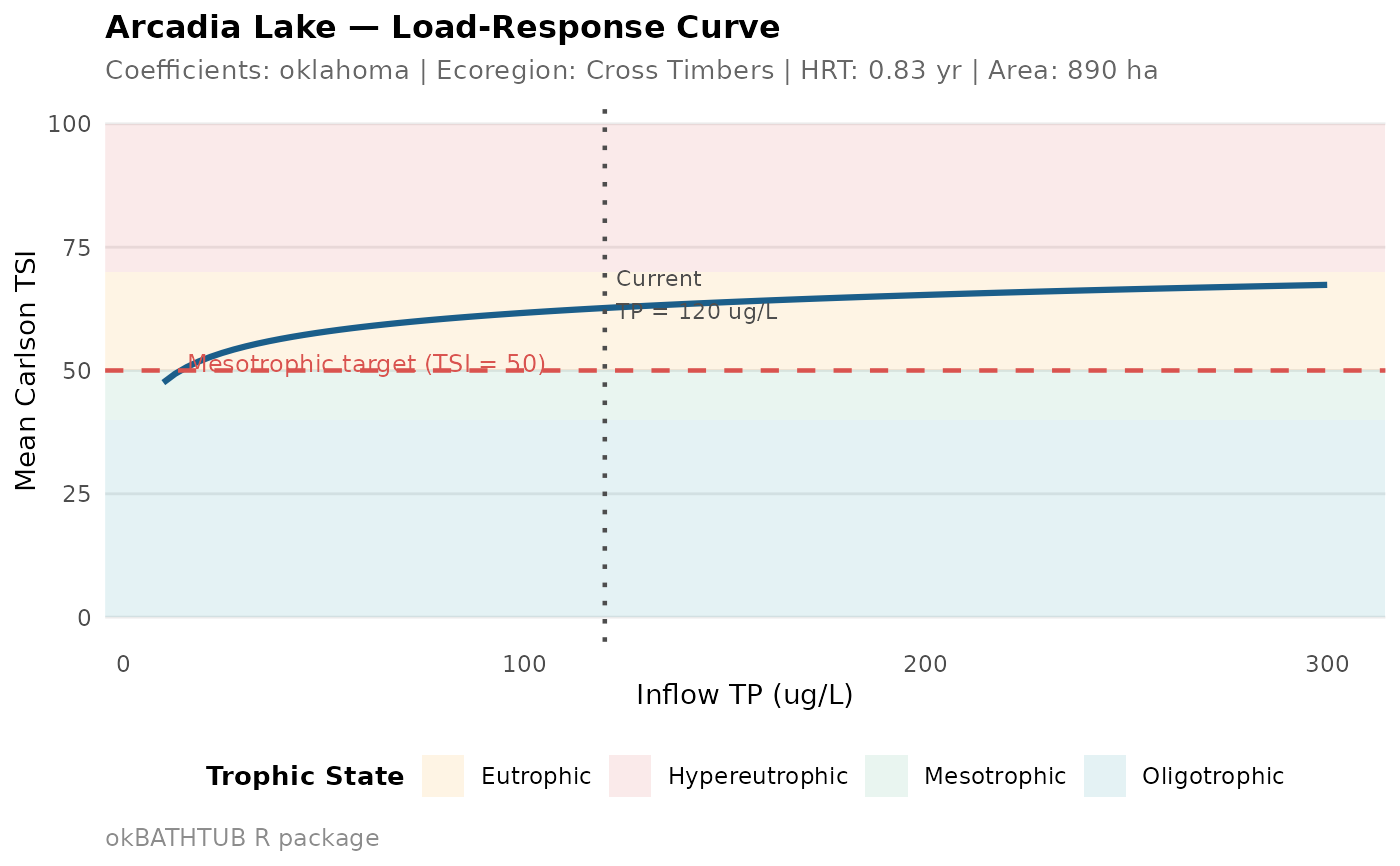
ok_plot_response() generates a load-response curve showing how
predicted in-lake chlorophyll-a, Secchi depth, or mean TSI responds to
a range of inflow total phosphorus concentrations. This is the core
planning tool for answering "what inflow TP concentration achieves
a given trophic state target?"
The curve is generated by running the full okBATHTUB pipeline across a sequence of TP concentrations while holding all other parameters constant at the baseline values.
Arguments
- baseline
An
okBATHTUBobject that has been run through at leastok_hydraulics(). Morphometry and coefficient set are taken from this object.- response
One of
"chla"(chlorophyll-a, ug/L),"secchi"(Secchi depth, m),"tsi"(mean Carlson TSI), or"tp_inlake"(in-lake TP, ug/L). Default"chla".- tp_range
Numeric vector of length 2. Range of inflow TP concentrations to plot (ug/L). Default
c(10, 300).- n_points
Integer. Number of points along the curve. Default 100.
- target_tsi
Numeric. Optional horizontal reference line showing a TSI target. Only shown when
response = "tsi".- target_class
Character. Trophic class target. Sets
target_tsiautomatically. One of"oligotrophic","mesotrophic","eutrophic".- show_trophic_bands
Logical. Show coloured trophic state background bands on TSI plots. Default
TRUEwhen response is"tsi".- current_tp
Numeric. Optional vertical reference line showing the current inflow TP concentration.
- lake_name
Character. Lake name for plot title. Default
NULL.
Examples
# \donttest{
baseline <- ok_load(
inflow_m3yr = 45e6,
tp_inflow_ugl = 120,
coefficients = "oklahoma",
ecoregion = "Cross Timbers"
) |>
ok_hydraulics(surface_area_ha = 890, mean_depth_m = 4.2)
ok_plot_response(baseline, response = "tsi",
target_class = "mesotrophic",
current_tp = 120,
lake_name = "Arcadia Lake")
 # }
# }