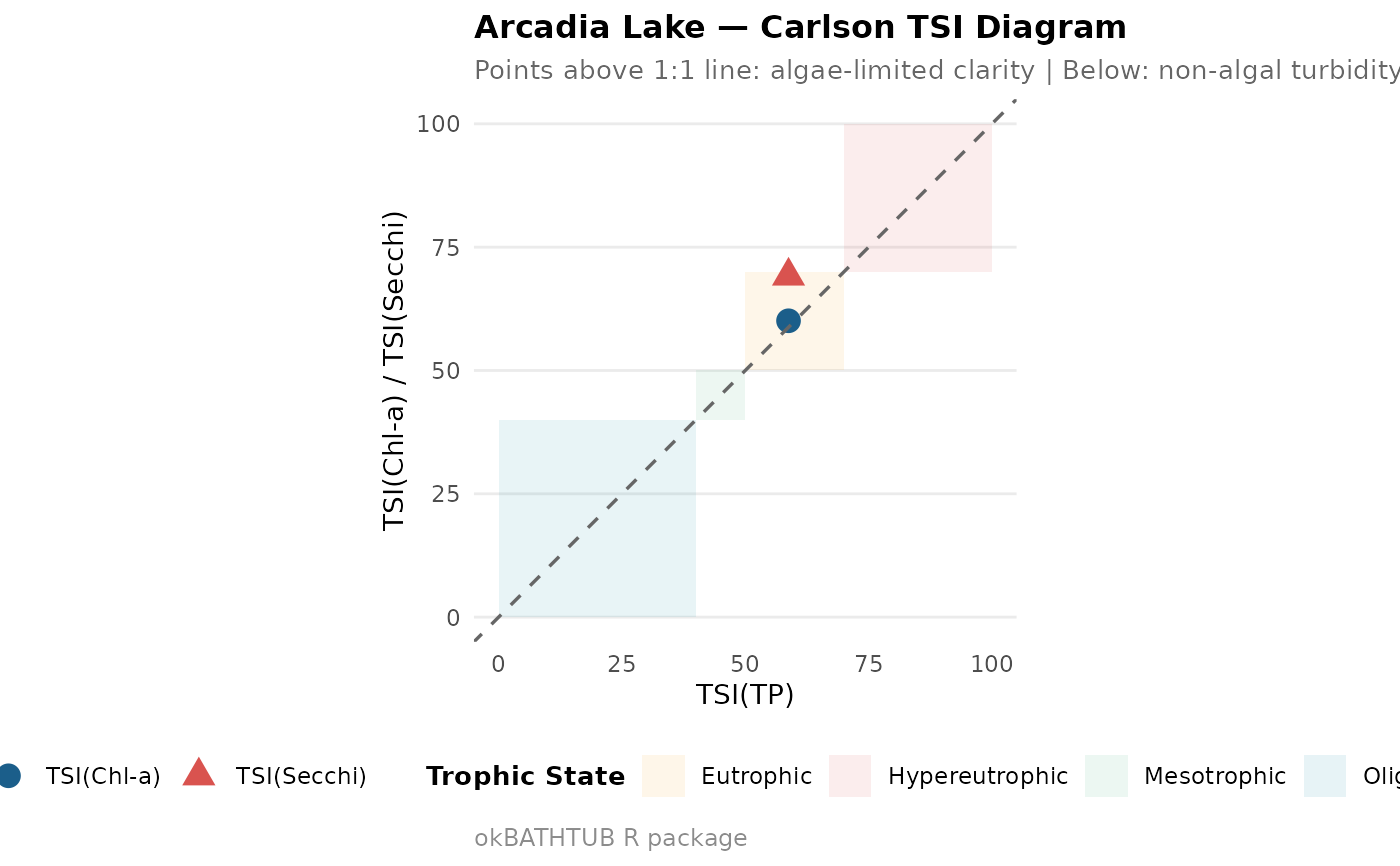
ok_plot_tsi() produces a Carlson (1977) TSI deviation diagram,
plotting TSI(TP) on the x-axis against TSI(Chl-a) and TSI(Secchi) on
the y-axis with trophic state background bands. Deviations from the
1:1 line indicate light limitation (Chl-a below TP line) or non-algal
turbidity (Secchi below Chl-a line).
Can accept either a single okBATHTUB result, or a data frame
containing the required TSI columns (e.g. from ok_scenario()
or a user-supplied observed-data summary).
Arguments
- x
An
okBATHTUBobject, or a data frame containing columnstsi_tp,tsi_chla, and optionallytsi_secchi. If a data frame, it may also containlake_nameandeco_l3_namefor grouping.- color_by
Character. Column name in a data frame to color points by. Common choices:
"eco_l3_name","trophic_state","lake_name". Ignored whenxis anokBATHTUBobject.- lake_name
Character. Lake name for the plot title when
xis anokBATHTUBobject.- show_diagonal
Logical. Show the 1:1 reference line. Default
TRUE.
References
Carlson, R.E. (1977). A trophic state index for lakes. Limnology and Oceanography, 22(2), 361-369.
Examples
# \donttest{
# From a single pipeline result
result <- ok_load(inflow_m3yr = 45e6, tp_inflow_ugl = 120,
coefficients = "oklahoma",
ecoregion = "Cross Timbers") |>
ok_hydraulics(surface_area_ha = 890, mean_depth_m = 4.2) |>
ok_retention() |>
ok_inlake() |>
ok_tsi()
ok_plot_tsi(result, lake_name = "Arcadia Lake")
 # }
# }