Plot a longitudinal water quality profile across reservoir segments
Source:R/plot.R
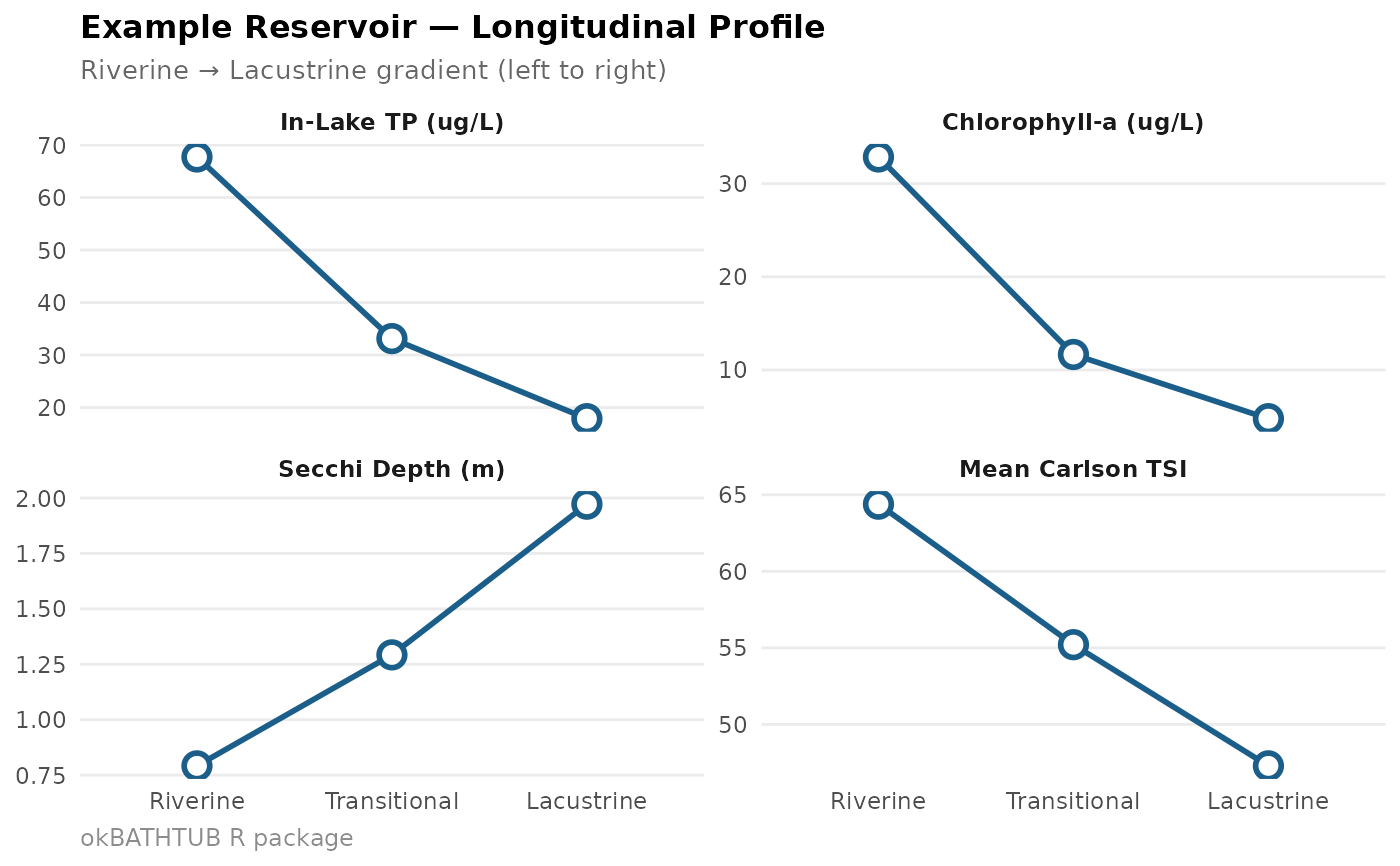
ok_plot_segments.Rdok_plot_segments() visualises the spatial gradient in water quality
from riverine to lacustrine zones of a multi-segment reservoir, using the
output of ok_segment_summary() or ok_segment_chain().
Usage
ok_plot_segments(
  segment_data,
  metrics = c("tp_inlake_ugl", "chla_ugl", "secchi_m", "tsi_mean"),
  lake_name = NULL
)
Arguments
- segment_data
Either a named list of
okBATHTUBobjects fromok_segment_chain(), or a data frame fromok_segment_summary().- metrics
Character vector. Which metrics to plot. Any subset of
c("tp_inlake_ugl", "chla_ugl", "secchi_m", "tsi_mean",
"tp_retention_pct")
. Default: first four.- lake_name
Character. Lake name for the plot title.
Examples
# \donttest{
segs <- list(
list(label = "Riverine", surface_area_ha = 280, mean_depth_m = 3.1),
list(label = "Transitional", surface_area_ha = 410, mean_depth_m = 4.5),
list(label = "Lacustrine", surface_area_ha = 610, mean_depth_m = 5.8)
)
chain <- ok_segment_chain(45e6, 150, tn_inflow_ugl = 2200, segments = segs)
ok_plot_segments(chain, lake_name = "Example Reservoir")
 # }
# }